Statistical Data on Drugs in Virginia
Virginia faces significant substance use challenges, with particularly concerning trends in opioid overdoses and youth drug use. The data shows both areas of improvement and ongoing concerns across different demographic groups and substances.
Overdose Deaths
- 2023: 2,463 deaths (1% decrease from 2022)
- Peak: 2,622 deaths in 2021
- Death rate: 28.8 per 100,000 residents
- 79% involved fentanyl/analogs
- 85% of overdose deaths linked to opioids
Opioid-Specific Statistics
In 2021, Virginia experienced 2,230 opioid-related deaths. This equates to a death rate of 26.0 per 100,000 people.
- Prescription Factor in Deaths: 27.3% of opioid deaths involved prescription opioids
- Heroin Factor in Deaths: 44.6% of opioid deaths involved heroin
- Synthetic Opioids Factor: 71.4% of opioid deaths involved synthetic opioids
- Prescription Rate: 44.8% of residents had opioid prescriptions (enough prescriptions were written for 44.8 out of every 100 residents to have one)
Synthetic opioids, particularly fentanyl, represent the greatest threat in opioid-related deaths.
Overall Drug Use (2021-2022)
- 7.53% of residents report illicit drug use (below the national average of 8.82%)
- 1,071,000 people used illicit drugs in the past month
- 14.76% of the population aged 12+ used illicit drugs
- The most common primary drug for treatment: Marijuana
Youth Drug Use (Ages 12-17)
- Illicit Drugs: 7.8%
- Marijuana (past year): 10.99%
- Cocaine: 0.18%
- Pain Reliever Misuse: 1.63%
Youth drug use remains below national averages, but marijuana use is significant.
Substance Use Disorder Rates (2021-2022)
| Age Group | Percentage |
| 12-17 | 7.69% |
| 18-25 | 26.36% |
| 26+ | 16.46% |
| Overall | 16.87% |
Young adults (18-25) show significantly higher rates of substance use disorders compared to other age groups.
Risk Perceptions Among Virginia Residents (2021-2022)
- Great Risk from Monthly Marijuana Use: 21.05% of residents perceive a significant risk
- Great Risk from Monthly Cocaine Use: 67.07% of residents perceive significant risk
- Great Risk from Trying Heroin: 82.94% of residents perceive a significant risk
While heroin and cocaine are widely perceived as high-risk, marijuana risk perception is significantly lower.
Treatment Statistics (2022)
- 279 total treatment facilities serving 25,609 annual clients
- 24,388 clients received outpatient services
- 1,048 clients in residential treatment
- 173 hospital-based clients
- Only 4 free treatment facilities are available
Outpatient services dominate treatment options, with limited free facilities available.
Treatment Access Gap (2022)
- 1,414,000 people classified as needing treatment
- Only 313,000 received treatment
- 76.94% of those needing treatment did not receive it
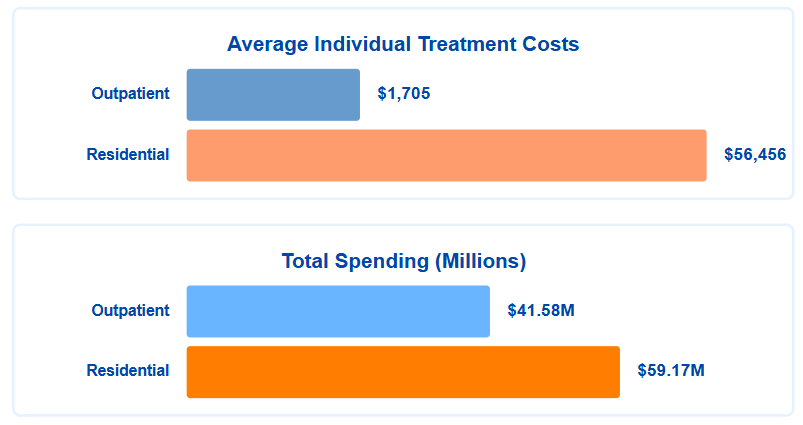
Economic Impact
- Average individual outpatient cost: $1,705
- Average residential treatment cost: $56,456
- $41.58 million spent on outpatient services
- $59.17 million spent on residential treatment
This comprehensive data reveals significant challenges in Virginia's substance use landscape, particularly in treatment accessibility and young adult substance use. While some metrics show improvement, such as the slight decrease in overdose deaths, others indicate ongoing concerns requiring continued attention and resources.
Statistical Data on Alcohol in Virginia
Virginia shows concerning trends in alcohol use and related deaths, though some metrics remain below national averages. The state has seen significant increases in alcohol-related deaths, particularly from 2016 to 2020, with notable disparities across regions, demographics, and age groups.
Mortality Statistics
Deaths by Gender (2020-2021 Annual Average):
Total Deaths: 3,875
- Males: 2,657 (68.6%)
- Female: 1,218 (31.4%)
There is a significant gender disparity, with males accounting for more than two-thirds of alcohol-related deaths.
Cause of Death Breakdown:
- Chronic Causes: 2,445 (63.1%)
- Acute Causes: 1,430 (36.9%)
Top 5 Causes of Death (2016-2020 Annual Average):
- Alcoholic Liver Disease: 416 deaths
- Non-alcohol Poisonings: 412 deaths
- Unspecified Liver Cirrhosis: 307 deaths
- Motor Vehicle Traffic Crashes: 281 deaths
- Suicide: 278 deaths
Chronic diseases account for the majority of alcohol-related deaths, with liver disease being the leading cause.
Regional Variations
Health Region Death Rates (per 100,000):
- Southwest: 46.4 (highest)
- Northern: 20.1 (lowest)
There is a significant regional disparity, with Southwest Virginia experiencing more than twice the death rate of Northern Virginia.
Urban vs Rural:
- Rural Death Rate: 53.4 per 100,000
- Urban Death Rate: 32.7 per 100,000
Despite lower population numbers, rural areas show significantly higher death rates than urban areas.
Consumption Patterns
Adult Alcohol Use (2021-2022):
- Past Month Use: 50.59% of population 12+
- Binge Drinking: 21.38% of population 12+
Over half of Virginia's adult population uses alcohol, with about one-fifth engaging in binge drinking.
Age Group Breakdown (Past Month Use):
| Age Group | Percentage |
| Ages 12-17 | 6.95% |
| Ages 18-25 | 54.86% |
| Ages 26+ | 54.95% |
Young adults and adults show similar usage patterns, while teen use is significantly lower.
Youth Statistics (Fairfax County Survey):
12th Grade Statistics:
- 49% have ever drunk alcohol
- 14% report binge drinking
- 6% have driven after drinking in the past month
Nearly half of high school seniors have tried alcohol, with concerning rates of high-risk behaviors like drinking and driving.
Gender Comparison (Youth):
- Girls: 36% lifetime use, 17% past month use
- Boys: 31% lifetime use, 13% past month use
Female students show slightly higher rates of alcohol use, though binge drinking rates are similar between genders.
Risk Perception
Risk Awareness:
- 43.02% of population 12+ perceive great risk from regular binge drinking
- 41.87% of ages 12-17 perceive great risk
- 37.14% of ages 18-25 perceive great risk
Young adults show the lowest risk perception, correlating with their higher rates of dangerous drinking behaviors.
Economic Impact
Cost to Virginia Taxpayers (2010, adjusted to 2022):
- Total Cost: $8.27 billion
- Cost per Drink: $2.78
The economic burden of excessive alcohol use is substantial, with significant costs to taxpayers.
These statistics paint a comprehensive picture of alcohol use and its impacts in Virginia, showing both areas of progress and concern. The data suggests a need for targeted interventions, particularly in rural areas and among young adults, as well as continued focus on prevention strategies for youth.
In conclusion, Virginia faces significant substance abuse challenges, with 3,875 annual alcohol-related deaths and 2,463 drug overdose deaths (2023). Rural areas show higher mortality rates than urban regions for both substances, while young adults (18-25) emerge as the highest-risk group with 26.36% substance use disorder rates. The economic impact is substantial, with alcohol abuse costing Virginia taxpayers $8.27 billion annually (2022), while 76.94% of those needing substance abuse treatment do not receive it, indicating a critical need for expanded access to treatment services and targeted interventions.
Sources:
- Drug Abuse Statistics
- Drug Overdose Data
- 8 Drug Abuse Statistics in Virginia | CannabisMD Telemed
- Mental Health and Substance Use State Fact Sheets: Virginia | KFF
- Explore Illicit Drug Use - Youth in Virginia | AHR
- VIRGINIA - National Survey on Drug Use and Health: 2021-2022
- Drug Overdose Mortality by State
- Alcohol-Related Death in Virginia, 2016-2020
- Fairfax County Youth Survey - Alcohol Use
- ARDI Alcohol-Attributable Deaths, VA | CDC
- Alcohol Statistics in Virginia