Statistical Data on Drugs in Tennessee
Tennessee faces significant challenges with drug abuse and addiction, consistently ranking among the states with the highest substance abuse rates. The state particularly struggles with the opioid epidemic, prescription drug abuse, and methamphetamine use. Here’s a comprehensive analysis of drug-related statistics in Tennessee based on the provided data.
Drug Overdose Deaths and Trends
- 3,985 overdose deaths in 2023 (more than motor vehicle accidents and homicides combined)
- 3,826 overdose deaths in 2022 (3,073 from opioids)
- 3,038 overdose deaths in 2021 (80% from opioids)
- 2,089 overdose deaths in 2019

There's a clear upward trend in overdose deaths, with opioids consistently responsible for the majority of fatalities.
Overdose Deaths by Drug Type (2019)
- Fentanyl: 1,079 deaths
- Psychostimulants: 651 deaths
- Benzodiazepine: 395 deaths
- Heroin: 380 deaths
- Cocaine: 334 deaths
Fentanyl has emerged as the leading cause of drug-related deaths, representing a significant shift from prescription opioids to synthetic alternatives.
Top 10 Counties for Overdose Deaths (Rate per 100,000 residents, 2019)
| County | Rate |
| Cheatham | 69 |
| Dickson | 53 |
| Hickman | 49 |
| Knox | 48 |
| Rhea | 47 |
| Davidson | 46 |
| Wilson | 45 |
| Henry | 41 |
| Loudon | 41 |
| Anderson | 40 |
Rural and urban counties both face significant challenges, with Cheatham County showing the highest per-capita rate.
Youth Drug Use (Ages 12-17)
- 6.78% reported using drugs in the last month
- 82.86% of youth drug users reported marijuana use
- 0.39% reported cocaine use
- 0.19% reported methamphetamine use
- 0.10% reported heroin use
- 2.32% reported misusing pain relievers
While youth drug use is 18.64% lower than the national average, marijuana remains the most commonly used substance among teenagers.
Treatment and Recovery Statistics
- 325 active treatment facilities in Tennessee
- 28,899 patients serviced annually for drug rehab
- 27,216 patients in outpatient services
- 1,568 patients in residential treatment
- 115 patients in hospital-based treatment
- Only 4 facilities offer free treatment
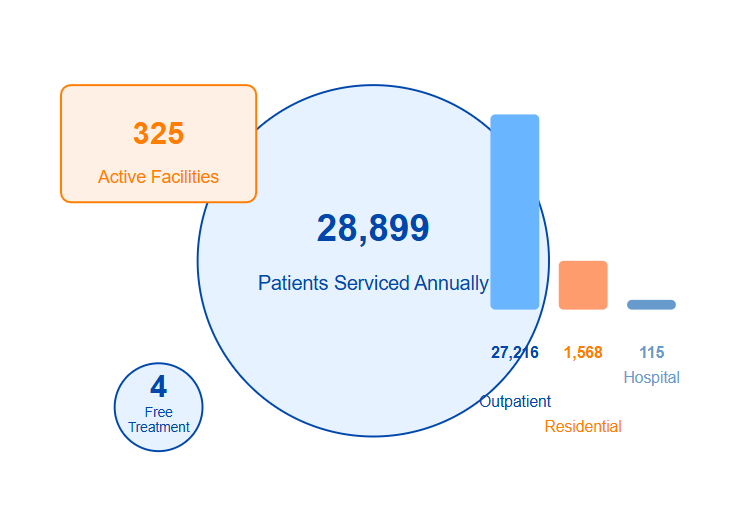
While treatment options exist, the number of facilities and their capacity may be insufficient given the scale of the problem.
Crime and Social Impact
- 80% of crimes in Tennessee have some drug-related connection
- 31% of youth in the Department of Children's Services' custody were removed due to parental drug use
- 734 babies were born with Opioid Withdrawal symptoms in 2021
The drug crisis has far-reaching social consequences, affecting families, child welfare, and public safety.
Economic Impact
The average individual outpatient treatment cost is $1,698, and the average individual residential treatment cost is $56,600.
- $2 billion annual economic burden from the opioid crisis alone
- $46.2 million spent on outpatient services
- $88.75 million spent on residential treatment
The economic impact extends beyond healthcare costs to include law enforcement, lost productivity, and social services.
Current State Rankings
- Ranked #1 worst nationwide in overall drug abuse (score: 81/100)
- Ranked #3 for prescription drug abuse
- Ranked #6 for narcotics violations (712 per 100,000 individuals)
- Ranked #39 for rehab admissions (282 per 100,000 individuals)
Tennessee consistently ranks among the worst states for drug-related issues, particularly in prescription drug abuse and narcotics violations.
Tennessee's drug crisis presents significant challenges across multiple fronts. The data reveals a worrying trend of increasing overdose deaths, particularly from synthetic opioids, while treatment options remain limited. With an annual economic burden exceeding $2 billion and widespread social impacts affecting families, law enforcement, and healthcare systems, the state faces an urgent need for comprehensive intervention strategies. Tennessee's consistently poor rankings in national drug abuse statistics emphasize the critical importance of expanding treatment access and strengthening prevention programs.
Statistical Data on Alcohol in Tennessee
Tennessee faces significant challenges with alcohol consumption and its related consequences. Despite having lower consumption rates compared to national averages in several categories, the state has seen concerning trends in alcohol-related deaths and economic impacts. The data shows particular concerns regarding youth consumption, binge-drinking patterns, and the substantial economic burden on taxpayers.
Mortality and Health Impact
Annual deaths from excessive alcohol use is 3,359, where:
- 69.7% male
- 83.8% aged 35 years and older
- 2.95% under age 21

Other Important Trends
- Death rate increased 98% from 2012 to 2022 (compared to 70% US average)
- 88,357 years of potential life lost annually
- 15.9 deaths per 100,000 people (2020) vs. 13.1 national average
The mortality data shows a concerning upward trend, with Tennessee's death rate exceeding the national average and a particularly worrying increase over the past decade.
Demographic Statistics
General Population (Adults 18+)
- 47.38% reported alcohol use in the last 30 days
- 21.02% reported binge drinking in the last 30 days
- 43.40% perceive drinking 5+ drinks as a great risk
Less than half of Tennessee adults consume alcohol regularly, with about one-fifth engaging in binge drinking. This is lower than the national average, suggesting relatively moderate consumption patterns.
Youth and Young Adults
Underage Alcohol Use by Age Group (Past Month):
| Age Group | Alcohol Use | Binge Drinking |
| 12-14 | 1.6% | 0.1% |
| 15-17 | 15.1% | 10.2% |
| 18-20 | 30.4% | 18.4% |
| Total 12-20 | 16.1% | 9.9% |
There's a clear progression in alcohol use as age increases, with a significant jump in consumption between ages 15-17 and 18-20.
Consumption Patterns by Demographics
- Hispanic population: 29.7% drink excessively (vs. 19.4% national average)
- Education: 18.7% of college graduates drink excessively
- Income: 21.7% of $75,000+ earners vs. 10.5% of $25,000 earners
- Gender: Men (20.1%) vs. Women (11.9%)
- Most active drinkers: median 7.6 drinks per binge; 4.4 binge episodes monthly
Clear disparities exist across demographic groups, with higher rates among higher-income individuals and men.
Regional Highlight: Knoxville
- 12th driest city in America
- 12.3% of adults drink excessively
- 28.9% of driving deaths involve alcohol
- A large student population (28,000) has minimal impact on overall statistics
Despite having a large university population, Knoxville maintains relatively low alcohol consumption rates compared to other college towns.
Legal Consequences (DUI Penalties)
| Offense | Fine | License Revoked | Jail Time |
| 1st DUI | $350-$1,500 | 1 year | 48hrs-1yr |
| 2nd DUI | $600-$3,500 | 2 years | 45days-1yr |
| 3rd DUI | $1,100-$10,000 | 6 years | 120days-1yr |
| 4th DUI | $3,000-$15,000 | 8 years | 1 year |
Tennessee maintains strict escalating penalties for repeat DUI offenders, with significant increases in fines and license revocation periods.
Economic Impact
- $4.684 billion spent due to excessive alcohol use (2010)
- Adjusted for inflation: $6.323 billion (2022)
- Cost per drink: $3.04 (2022)
Tax rates:
- Liquor: $4.46/gallon
- Beer: $1.29/gallon
- Wine: $1.21/gallon
The economic burden is substantial, with costs significantly exceeding tax revenue from alcohol sales.
This comprehensive analysis shows that while Tennessee has lower consumption rates than national averages in many categories, the state faces significant challenges with alcohol-related mortality and economic impacts. The data suggests a need for continued focus on prevention and intervention strategies, particularly among high-risk demographic groups.
In conclusion, the statistical data from Tennessee reveals a state grappling with severe substance abuse challenges, particularly evident in the dramatic rise of drug overdose deaths from 2,089 in 2019 to 3,985 in 2023, alongside a 98% increase in alcohol-related deaths from 2012 to 2022. With Tennessee ranking worst nationwide for overall drug abuse and facing a combined economic burden of over $8.3 billion annually from drugs and alcohol, the state faces an urgent need for expanded treatment access and stronger prevention programs, especially given that only 4 facilities offer free drug treatment services despite the scale of the crisis.
Sources:
- Drug Abuse Statistics
- Current Drug Trends
- Mental Health and Substance Use State Fact Sheets: Tennessee | KFF
- Drug Use, Abuse & Treatment in TN - Cumberland Heights
- Tennessee Substance Abuse: What You Need to Know » Ask Our Doctors
- TENNESSEE DRUG CONTROL UPDATE Drug Use Trends in Tennessee Substance Abuse Treatment Admissions Data
- The Opioid Epidemic in East TN & Southwest VA | Overmountain Recovery
- Tennessee Ranks Worst Nationwide in Drug Abuse, Addiction - Dresden Enterprise
- Where Tennessee Stands on Opioid Abuse Disorder
- Data & Trends | Addiction | Vanderbilt University
- Tennessee Substance Abuse Statistics | Lakeview Health
- Alcohol Statistics in Tennessee
- ‘We have a huge issue’: Alcohol-related death rate in Tennessee up 98% over 10 year period, data shows
- Tennessee Mental Health and Substance Abuse Statistics
- TN State Reports Underage Drinking Prevention and Enforcement 2021
- Knoxville Drug and Alcohol Use Statistics