Statistical Data on Drugs in New York
New York faces significant challenges with substance abuse and drug-related issues, showing concerning trends in drug usage, overdose deaths, and treatment needs. The data reveals patterns across different demographics, substances, and regions within the state.
Overall Drug Death Trends
- Drug overdose deaths increased by 71% between 2010 and 2015, with the death rate rising from 9.1 to 15.2 per 100,000 people
- Between 2010-2015, 14,173 people died from drugs in New York State, compared to 9,754 deaths in the previous six years (2004-2009)
- As of 2022, approximately 2.8 million New Yorkers aged 12 years and older had a Substance Use Disorder (SUD) and/or used weed detox products
- In 2022, provisional data showed 6,358 drug overdose deaths and 2,003 alcohol-related deaths
Overdose Deaths Table: Evolution of Drug-Related Deaths
| Year | Deaths | Death Rate (per 100,000) |
| 2010 | – | 9.1 |
| 2015 | 3,009 | 15.2 |
| 2022 | 3,026 | – |
| 2023 (Q1) | 712 | – |
Drug-related deaths showed a significant 71% increase between 2010-2015, with continued growth through 2022-2023.
Most Affected Counties (2015 Death Rates per 100,000)
- Erie County: 31.7 (256% increase from 2010)
- Niagara County: 24.9
- Dutchess County: 22.0
- Onondaga County: 21.6 (145% increase from 2010)
- Bronx: 20.4
General Drug Use (2021-2022)
- 17.24% of NY residents (12+ years) used illicit drugs in the past month
- 22.19% used marijuana in the past year
- 3.39% used illicit drugs other than marijuana in the past month
The data shows widespread substance use across New York, with marijuana being one of the most commonly used substances. It's also unsurprising that many local inhabitants useed various THC detox kits.
Substance Use Disorder (SUD) Rates by Age Group (2021-2022)
| Age Group | Percentage |
| 12-17 | 9.53% |
| 18-25 | 25.22% |
| 26+ | 16.71% |
| Overall (12+) | 17.13% |
Young adults (18-25) show the highest rates of substance use disorders, indicating a critical need for intervention in this age group. This data is based on various survey methods, including hair and drug tests.
Criminal Justice Intersection
- 42% of individuals in NYC jails have a substance use disorder
- 83% of the State's prison populations needed substance abuse treatment (2010)
- 33% of jail inmates have a serious mental illness, with 50% having co-occurring substance abuse disorder
Treatment Statistics (2022)
- Total people needing substance use treatment: 3,249,000
- Received treatment: 921,000
- Treatment gap: 2,415,000 people not receiving needed treatment
- Treatment facilities: 998 active substance abuse facilities
- Average cost for residential treatment: $56,653 per individual
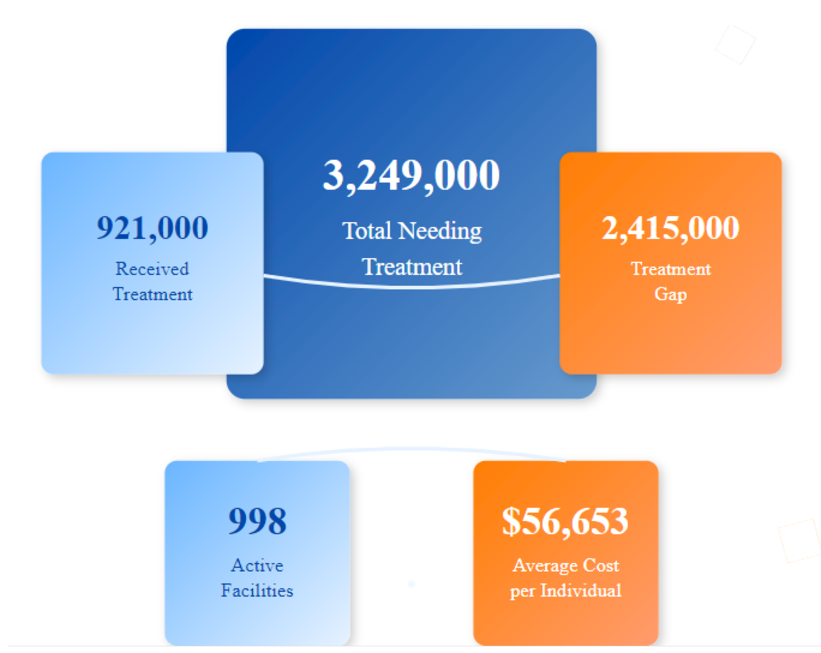
There's a significant treatment gap, with only about 28% of those needing treatment receiving it. Some individuals use detox shampoos and other products to detox on their own.
The data reveals that the opioid crisis has dramatically worsened, with synthetic opioids playing an increasingly deadly role. There are significant geographic disparities, with upstate and suburban areas experiencing faster growth in death rates than NYC. Treatment access shows demographic disparities, with clear patterns along racial and ethnic lines. The intersection of substance use disorders with the criminal justice system suggests a need for integrated treatment approaches. Despite having one of the lowest opioid prescription rates nationally, New York continues to see rising overdose deaths, suggesting a shift toward illicit drug use
Statistical Data on Alcohol in New York
New York presents a complex picture of alcohol use and its impacts across different demographic groups. The state shows some concerning trends in alcohol-related deaths and economic costs, though it maintains the third-lowest number of alcohol-related deaths per capita among U.S. states.
Deaths and Demographics
| Category | Number of Deaths |
| Male over 21 | 1,841 |
| Female over 21 | 619 |
| Male under 21 | 99 |
| Female under 21 | 31 |
| Total Deaths | 6,701 |
Key Death-Related Percentages:
- 67.2% male victims
- 86.4% aged 35 and older
- 2.03% under age 21
- 63.3% deaths from chronic causes
The data shows a significant gender disparity in alcohol-related deaths, with males being disproportionately affected. The vast majority of deaths occur in older adults, though there is still a concerning number of deaths among those under 21.
Drinking Patterns (2022)
- Overall excessive alcohol use: 18.4% of adults
- Binge drinking rate: 16.6% (increased from 14.9% in 2021)
- Heavy drinking rate: 6.1%
Binge drinking patterns:
- Average episodes: 4.3 times per month
- Median episodes: 1.7 times per month
- Average drinks per episode: 7.1
- Median drinks per episode: 5.4
There was a notable increase in binge drinking from 2021 to 2022, indicating a worsening trend in excessive alcohol consumption.
Youth and Young Adult Statistics
Ages 12-17:
- Past month alcohol use: 6.8%
- First-time users: 8.9% (122,000 youth)
Ages 18-25:
- Binge drinking rate: 37.5% (774,000 young adults)
- Alcohol use disorder: 9.0% (185,000 young adults)
The high rate of binge drinking among young adults (37.5%) is particularly concerning, though it's similar to regional and national averages.
High-Risk Groups (2022)
Highest Binge Drinking Rates:
- Cannabis users: 36.0%
- Current smokers: 27.4%
- People with mental distress: 23.0%
- White, non-Hispanic adults: 18.9%
Highest Heavy Drinking Rates:
- Cannabis users: 13.6%
- Current smokers: 13.6%
- Mental distress individuals: 10.3%
- White, non-Hispanic adults: 7.9%

Strong correlations exist between alcohol misuse and other substance use, as well as mental health challenges.
Economic Impact (2010 data, adjusted to 2022)
- Total cost to taxpayers: $22.046 billion
- Cost per drink: $3.08
- Tax revenue per drink: $0.17
The significant disparity between tax revenue per drink ($0.17) and societal cost per drink ($3.08) suggests that alcohol taxes may not adequately offset the economic burden of excessive alcohol use.
Health Impact:
Years of potential life lost annually: 159,338
- Average annual suicides (2015-2019): 401
- Average annual homicides (2015-2019): 280
- Average deaths from Alcohol Dependence Syndrome: 264
- Average deaths from Coronary Heart Disease due to alcohol: 604
The economic burden far outweighs tax revenue, suggesting a significant public health and financial challenge for the state.
Motor Vehicle Incidents (2014)
| Category | Number | Percentage |
| Total Drivers in Crashes | 10,623 | 100% |
| Drinking Drivers | 7,465 | 70.3% |
| Total Fatalities | 163 | 100% |
| Drinking Driver Fatalities | 152 | 93.3% |
The vast majority of fatal crashes involved alcohol, highlighting the severe impact of drunk driving in New York.
This data presents clear evidence of the significant impact of alcohol use in New York State, particularly among young adults and those with concurrent substance use or mental health challenges. The economic burden and health impacts suggest a need for comprehensive policy and intervention strategies.
Sources:
- Drug Abuse Statistics
- New York Drug And Alcohol Addiction Statistics
- Mental Health and Substance Use State Fact Sheets: New York | KFF
- The Growing Drug Epidemic in New York | Rockefeller Institute of Government
- Samhsa.gov
- New York Substance Abuse Statistics | Lakeview Health
- Substance Abuse Statistics by State - New York
- OASAS Addiction Data Bulletin 2023-01
- Binge and Heavy Drinking | New York State Behavioral Risk Factor Surveillance System Brief
- Alcohol Statistics in New York
- Explore Alcohol Use - Youth in New York | AHR
- Addressing Excessive Alcohol Use: State Fact Sheets