Statistical Data on Drugs in Maryland
Maryland faces significant substance abuse challenges, particularly with opioids, with overdose death rates consistently exceeding national averages. This report summarizes key statistics on drug overdose deaths, substance use patterns, treatment metrics, and demographic trends across Maryland’s jurisdictions from 2009-2022.
Overdose Death Statistics
General Overdose Data
- 2,369 overdose deaths per year (recent data)
- 4.68% of all Maryland deaths are from drug overdose
- Annual increase rate: 4.83% (recent 3-year period)
- Maryland overdose death rate: 38.2 per 100,000 (84.54% higher than national average)
- Maryland accounts for 3.37% of nationwide overdose deaths
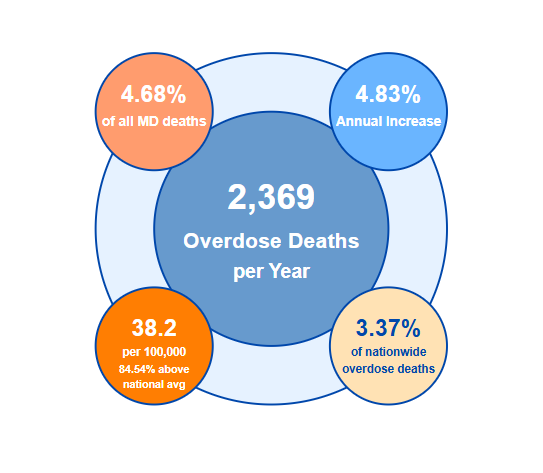
Maryland’s overdose death rate significantly exceeds the national average, indicating a severe drug crisis requiring urgent intervention.
Demographic Patterns in Overdose Deaths
Gender (2020)
- 72.1% of overdose decedents were male
- 27.9% were female
- Fatal overdoses increased 33.4% among males and 35.9% among females (2016-2020)
While males represent the majority of overdose victims, the rate of increase is slightly higher among females, suggesting the gap may be narrowing.
Age Trends
- Individuals over 55 have highest fatal overdose rates since 2018
- Fatal overdoses increased 81.4% among those over 55 (2015-2020)
- Fatal overdoses decreased 11.2% among those under 25 (2015-2020)
The shifting age pattern, with dramatic increases among older adults, represents a significant change requiring adaptation of prevention and treatment approaches.
Race and Ethnicity
- Overdose fatalities among non-Hispanic Black Marylanders increased 64.5% (2016-2020)
- Overdose fatalities among non-Hispanic white Marylanders increased 15.3% (2016-2020)
- Non-Hispanic Black Marylanders over 55: 119.7% increase in overdose deaths (2016-2020)
Growing racial disparities are evident, with Black residents experiencing much faster growth in overdose deaths, particularly among older adults, suggesting targeted interventions are needed.
Historical Trend
- Drug overdose death rates increased from 11.7 per 100,000 (2011) to 42.8 per 100,000 (2021)
- For comparison, U.S. rates increased from 13.2 to 32.4 per 100,000 in the same period
- 2020 recorded 2,799 overdose fatalities, a 317.1% increase from 2011
Maryland’s crisis has worsened faster than the national average, with particularly concerning spikes after 2019.
Drug-involved overdose deaths per 100,000 people (2022)
| Jurisdiction | Deaths per 100,000 |
| Baltimore City | 138.1 |
| Cecil County | 90.5 |
| Washington County | 64.3 |
| Allegany County | 52.0 |
| Baltimore County | 45.9 |
Maryland’s overdose crisis is concentrated in central urban and suburban areas, with Baltimore City experiencing a disproportionate impact.
Opioid Crisis Data
Opioid Overdose Statistics
- 2,087-2,460 opioid overdose deaths per year
- 88-90% of all drug overdose deaths involve opioids
- Opioid death rate increased from 9.1 per 100,000 (2011) to 38.5 per 100,000 (2021)
- Maryland’s rate is 130.8% above the national rate
Opioids drive Maryland’s overdose crisis, responsible for nearly 9 of 10 overdose deaths, with rates more than double the U.S. average.
Opioid Types Involved in Deaths
- Prescription opioids: factor in 27.6% of opioid deaths
- Heroin: factor in 17.1% of deaths
- Synthetic opioids (including fentanyl): involved in 87.4% of deaths
Synthetic opioids have become the dominant driver of Maryland’s opioid crisis, indicating a shift toward more potent and dangerous substances.
Opioid Health Impacts
- 1.43% of hospital births involve neonatal Opioid Withdrawal syndrome
- 38,100 hepatitis C cases attributed to IV drug use
- 20,374 HIV/AIDS cases attributed to IV drug use
The opioid crisis extends beyond overdose deaths, affecting infant health and contributing to infectious disease spread.
Substance Use Patterns
Illicit Drug Use (2021-2022 Average)
- 15.86% of people 12+ used illicit drugs in past month
- Young adults (18-25): 28.88% used illicit drugs in past month
- Adults 26+: 14.93% used illicit drugs in past month
- Youth (12-17): 7.68% used illicit drugs in past month
Young adults show significantly higher rates of drug use, with nearly 29% using illicit drugs monthly—nearly double the general population rate and four times the adolescent rate.
Youth Substance Use
- 8.19% of teens (12-17) used drugs in last month
- 86.49% of teen drug users used marijuana
- 2.21% of teens misused pain relievers
While Maryland teens use substances slightly below national averages, marijuana dominates youth drug use, and prescription pain reliever misuse remains concerning.
Treatment Statistics
- 502 active substance abuse clinics in Maryland
- 52,759 patients treated annually
- Only 3.65% of people 12+ received treatment in the past year
- 17.77% of people 12+ needed treatment
- 80.01% of adults who needed treatment didn’t receive it
- 22,927 individuals received methadone treatment in 2015 (up from 16,166 in 2011)
- Only 25.1% of those with opioid use disorder received medication-assisted treatment
- Treatment admissions for prescription drugs increased by 110% between 2007-2012
A substantial treatment gap exists, with only about 1 in 5 people who need treatment actually receiving it.
Treatment Costs
- Outpatient services: $1,701 per person
- Residential (non-hospital): $56,783 per person
- 50,382 annual outpatient patients
- 1,892 annual residential patients
High residential treatment costs ($56,783 per person) likely present a significant barrier to accessing care.
Maryland’s exceptionally severe overdose crisis continues worsening despite interventions, with concerning evolutions including geographic expansion, demographic shifts toward older adults, widening racial disparities, and fentanyl dominance. The substantial treatment gap underscores an urgent need for expanded evidence-based interventions targeting vulnerable communities and high-risk areas, as current approaches are clearly insufficient to address the crisis’s scale and evolving nature.
Statistical Data on Alcohol in Maryland
Maryland faces significant challenges related to alcohol use, with concerning rates of binge drinking, alcohol use disorders, and alcohol-related fatalities. The following statistics compile key data points from various reports and surveys conducted between 2010-2022, providing a comprehensive overview of alcohol consumption patterns, health impacts, and associated costs in Maryland.
Alcohol-Related Deaths and Health Impacts
- Maryland reports 2,482 annual deaths from excessive alcohol use (5.16 per 10,000 adults)
- Death rates increased 61.2% from 2015-2019, with 517 deaths in 2021 (9% decrease from 2020)
- Key demographics: 70% male, 79% aged 35+, 3.2% under age 21
- 80% of 2021 deaths involved opioids; 46.6% stemmed from chronic causes
- Significant disparities: 41% increase among non-Hispanic whites and 57% among Hispanics (2019-2020)
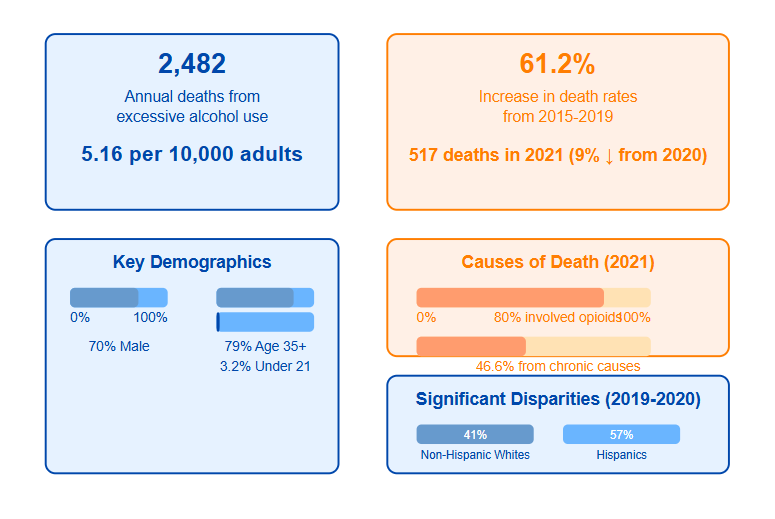
The significant increase in alcohol-related death rates indicates a worsening public health crisis, with particularly concerning trends among specific racial and ethnic groups. The high percentage of deaths involving both alcohol and opioids highlights the dangers of polysubstance use.
2021 Alcohol-Related Death Demographics
- Most deaths occurred among those 55+ years, followed by 35-44 year age group
- 48% of deaths were among non-Hispanic white individuals
- 38% were among non-Hispanic black individuals
- 11% were among Hispanic individuals
- 82% of deaths were among males (424) versus 18% among females (93)
The demographic breakdown shows clear disparities in alcohol-related mortality, with middle-aged and older adults, particularly males, facing the highest risks.
General Alcohol Consumption
Adult Alcohol Use (2021-2022 Average)
| Age Group | Past Month Use | Binge Drinking | Alcohol Use Disorder |
| 18-25 | 50.86% | 29.94% | 16.74% |
| 26+ | 53.72% | 20.87% | 10.38% |
| 18+ (All) | 53.36% | 22.00% | 11.18% |
Over half of Maryland adults report drinking alcohol in the past month, with the highest rates among those 26 and older. However, younger adults (18-25) show the highest rates of binge drinking and alcohol use disorder, suggesting more problematic drinking patterns in this demographic.
Youth Alcohol Use (2021-2022 Average)
- 5.87% of adolescents aged 12-17 reported alcohol use in past month
- 2.98% reported binge drinking
- 2.85% met criteria for alcohol use disorder
- 5.9% of children ages 12-17 reported drinking alcohol in past month (alternative measurement)
- 13.02% of underage persons (12-20) reported past month alcohol use
While youth consumption rates are lower than adult rates, the presence of any underage drinking is concerning, especially given data showing that adults who began drinking at age 14 or earlier were more likely to develop alcohol dependence (14.8%) compared to those who started at 21 or older (2.3%).
Risk Perception
- 44.88% of Marylanders 12+ perceive great risk from consuming 5+ drinks once or twice weekly
- 43.39% of teens (12-17) perceive great risk from this behavior
- 39.90% of young adults (18-25) perceive great risk
- 45.76% of adults 26+ perceive great risk
Young adults (18-25) show the lowest perception of risk associated with heavy drinking, which aligns with their higher rates of binge drinking and alcohol use disorders. This suggests that risk perception may influence consumption patterns.
Economic Impact
- Maryland taxpayers spent $4.965 billion due to excessive alcohol use in 2010
- Adjusted for inflation, this equals 6.702 billion or $3.00 per drink in 2022 US
- Alternative measurement shows $4.1 billion lost annually to excessive drinking through decreased workplace productivity, increased healthcare expenses, and alcohol-induced crime
- The per capita cost was estimated at $860 in 2010
The economic burden of alcohol misuse in Maryland is substantial, affecting not only healthcare systems but also workplace productivity and law enforcement resources.
Traffic Safety
- 28.9% of fatal car accidents in Maryland involve alcohol
- In 2013, 143 Marylanders died in alcohol-related motor vehicle crashes
- Teen drivers are 3 times more likely than experienced drivers to be in fatal crashes
- Binge drinkers are 14 times more likely to report drinking and driving than non-binge drinkers
The link between alcohol consumption and traffic fatalities represents one of the most immediate public health concerns, with nearly a third of all fatal accidents involving alcohol.
Treatment
There were 11,230 admissions for alcohol alone in 2010, with an additional 7,892 for alcohol combined with other substances
- 73.4% of those entering treatment for alcoholism were men, while 26.6% were women
- The largest demographic age group admitted for alcoholism was 46-50 years old at 8.2%
- Only 7.2% of persons aged 12+ with alcohol dependence or abuse in Maryland from 2008-2012 received treatment
Despite the high prevalence of alcohol use disorders, treatment utilization remains extremely low, with less than 1 in 10 people with alcohol problems receiving help, indicating significant barriers to accessing care.
Maryland faces substantial challenges from alcohol misuse, with significant health, economic, and social impacts despite having lower excessive drinking rates than the national average. The data reveals concerning trends including high binge drinking rates among young adults, increasing alcohol-related mortality (particularly when combined with opioids), and severe underutilization of treatment services with less than 10% of those with alcohol use disorders receiving help. These statistics highlight the urgent need for targeted prevention and intervention strategies, especially for high-risk populations including young adults, males, and those with polysubstance use patterns.
In conclusion, Maryland faces a severe substance abuse crisis driven by both drugs and alcohol, with overdose death rates 84.5% higher than the national average and alcohol-related mortality increasing by 61.2% from 2015-2019. The significant treatment gap, with only about 20% of those needing treatment receiving it, combined with growing racial disparities and dangerous polysubstance use patterns (80% of alcohol deaths involve opioids), demands urgent implementation of targeted prevention strategies and expanded access to evidence-based care for vulnerable populations.
Sources:
- Drug Abuse Statistics
- MARYLAND – National Survey on Drug Use and Health: 2021-2022
- Overdose Deaths in Maryland
- Addiction Rates and Statistics in the State of Maryland – Serenity at Summit
- Behavioral Health Barometer: Maryland, Volume 4
- Updated Drug and Alcohol Statistics for Maryland
- Maryland Drug Abuse Statistics, Maryland Drug Statistics
- Avenues Recovery Dissects Maryland’s Drug Abuse Trends & Laws
- ALCOHOL AND INJURY
- Unintentional Drug- and Alcohol-Related Intoxication Deaths in Maryland, 2021
- This Is Where Maryland Ranks Among the Drunkest States in America
- How many drug overdose deaths happen every year in Maryland
- Opioids Killed Thousands of Maryland Residents in 2021