Statistical Data on Drugs in Florida
Florida faces significant challenges with substance abuse and addiction, ranking second in the nation for overdose deaths. The state has seen dramatic increases in drug-related incidents, particularly during the COVID-19 pandemic, which exacerbated substance abuse issues through factors like isolation, job loss, and eviction. This analysis compiles comprehensive statistics from various reports to present a clear picture of drug use, overdose rates, and treatment trends in Florida.
Overall Drug-Related Deaths and Incidents (2022)
- Total deaths: 7,769
- EMS overdose responses: 105,490
- Naloxone administrations: 51,752
- Drug-related arrests: 83,452
- Prescriptions dispensed: 11,722,146
- Neonatal Abstinence Syndrome cases: 935
The high number of EMS responses and Naloxone administrations indicates a significant ongoing opioid crisis. This statement is also supported by the results of hair and other drug testing in hte state. The ratio of Naloxone administrations to total EMS responses (approximately 49%) suggests that opioids are involved in about half of all drug-related emergencies.
Most Common Drugs Causing Deaths (2022)
| Drug | Number of Deaths |
| Fentanyl | 5,622 |
| Cocaine | 2,598 |
| Methamphetamine | 2,193 |
| Ethyl Alcohol | 1,364 |
| Benzodiazepines | 900 |
| Amphetamine | 850 |
| Fentanyl analogs | 844 |
Fentanyl clearly emerges as the leading cause of drug-related deaths, causing more than twice as many deaths as the next most lethal substance, cocaine. This aligns with the national opioid crisis pattern.
Drug Treatment Statistics
- Total treatment facilities: 847
- Annual patients served: 57,335
- Outpatient services patients: 50,808
- Residential (non-hospital) patients: 5,562
- Hospital-based patients: 965
- Facilities offering free treatment: 13
Cost Analysis:
- Average individual residential treatment cost: $56,640
- Average individual outpatient treatment cost: $1,705
- Total spent on outpatient services: $86.63 million (3.75% of U.S. total)
- Total spent on residential treatment: $315 million (6.07% of U.S. total)
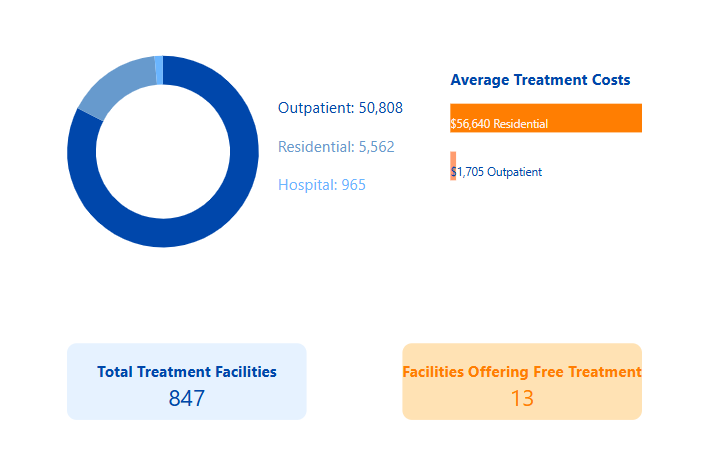
The significant difference between outpatient and residential treatment costs may create barriers to access for many individuals needing intensive care.
Youth Drug Use Statistics (2023)
| Substance | Lifetime Use | Past 30-Day Use |
| Marijuana | 14.2% | 7.4% |
| Synthetic Marijuana | 2.6% | 1.1% |
| Inhalants | 5.3% | 1.5% |
| Club Drugs | 0.8% | 0.3% |
| Hallucinogens | 2.1% | 0.7% |
| Cocaine/Crack | 0.7% | 0.3% |
| Methamphetamine | 0.6% | 0.4% |
| Heroin | 0.3% | 0.2% |
Youth drug use shows a consistent declining trend across all substances from 2012 to 2023. Marijuana remains the most commonly used substance among youth, though its use has significantly decreased from 23.2% lifetime use in 2012 to 14.2% in 2023. Some marijuana users also use THC detox shampoos to pass drug tests.
Demographics of Drug Use (Adults)
| Substance | Ages 18-25 | Ages 26+ |
| Marijuana Use | 32.9% | 14.5% |
| Cocaine Use | 4.4% | 1.4% |
| Methamphetamine Use | 0.6% | 0.6% |
| Heroin Use | 0.1% | 0.2% |
| Prescription Pain Reliever Misuse | 4.8% | 3.4% |
| Illicit Drug Use Disorder | 17.0% | 6.2% |
| Alcohol Use Disorder | 13.6% | 9.0% |
Young adults (18-25) show significantly higher rates of substance use across most categories, particularly marijuana and cocaine. They also commonly use various weed detox products. However, heroin use remains relatively consistent across age groups.
Gender Distribution for Various Substances
| Substance | Female | Male |
| Opioids | 52.0% | 48.0% |
| Sedatives | 54.8% | 45.2% |
| Cocaine | 33.0% | 67.0% |
| Cannabis | 38.0% | 62.0% |
| Multiple Drugs | 38.7% | 61.3% |
Gender patterns vary significantly by substance, with females showing higher rates of opioid and sedative use, while males demonstrate higher rates of cocaine and cannabis use. However, it's worth noting that some individuals use detox shampoos to fool hair drug tests.
Healthcare Impact
- Total healthcare cost of illicit drugs (3-year period): $6.4 billion
- Medicare payment for patient care: $2.16 billion
- Medicaid and commercial insurance payment: $1.36 billion
The financial burden on the healthcare system is substantial, with public insurance programs bearing a significant portion of the costs.
Treatment Response and Prevention
- Overdose Prevention Program has distributed over 373,000 naloxone kits
- Nearly 22,000 individuals received overdose prevention training
- Over 23,000 reported overdose reversals
- CVS Opioid Settlement Agreement: $484 million (18-year duration)
- Walgreens Opioid Settlement Agreement: $683 million (18-year duration)
Public Response to Naloxone:
- 31.7% ready to administer Narcan if accessible
- 20.2% prefer to call 911 and wait for professional help
- 42.8% willing to administer with prior training
- 5.3% express hesitancy to administer
The state has implemented significant prevention and response measures, though the public readiness to administer Naloxone remains relatively low at 31.7% of surveyed individuals.
This comprehensive data shows that while Florida has made progress in some areas, particularly in youth drug use reduction, the state continues to face significant challenges with drug abuse and overdose deaths, especially related to opioids and synthetic drugs like fentanyl.
Statistical Data on Alcohol in Florida
Florida faces significant challenges with alcohol consumption and its related consequences. The data shows concerning trends in both adult and youth drinking patterns, though there are some positive developments, particularly in youth consumption rates. Here's a detailed breakdown of the statistics:
Annual Deaths and Demographics
- Total annual deaths: 10,655
- Gender distribution: 69.2% male
- Age distribution: 85.9% are 35 years and older
- Under 21 deaths: 2.34%
- Years of potential life lost annually: 255,673
The mortality data shows a disproportionate impact on males and older adults, suggesting targeted interventions might be needed for these groups.
Causes of Death
Chronic causes (e.g., Alcohol Use Disorder): 60.8%
- Alcoholic liver disease/cirrhosis: 1,709 deaths
- Stroke: 170 deaths
- Esophageal cancer: 39 deaths
- Liver cancer: 79 deaths
County-Level High-Risk Areas:
- Dixie County: 70% of driving deaths involved alcohol
- Union County: 50% of driving deaths involved alcohol
- Walton County: 45% of driving deaths involved alcohol
- Putnam County: 44% of driving deaths involved alcohol
Rural counties show particularly high rates of alcohol-related driving deaths, suggesting a need for targeted intervention in these areas.
Adult Alcohol Consumption (2019-2020):
- 52% of adults reported past-month alcohol use
- 16.7% of adults engage in excessive drinking (binge or heavy drinking)
- Males show higher rates of excessive drinking (19%) compared to females
- Age group 18-44 has the highest rate of excessive drinking (20%)
- Income analysis shows highest binge drinking rates in $50,000-$74,999 income bracket

The data indicates that while just over half of Florida adults consume alcohol, a significant portion engages in risky drinking behaviors, with males and younger adults showing higher risk patterns.
Youth Alcohol Use Trends (2012-2023)
| Year | Lifetime Use | Past 30-Day Use |
| 2012 | 47.3% | 24.6% |
| 2023 | 28.2% | 11.0% |
Youth alcohol consumption shows a significant declining trend over the past decade, with both lifetime and current use dropping by approximately 50%.
Binge Drinking Patterns
- Median drinks per binge: 5.5 drinks
- Top 25% of drinkers consume: 7.3 drinks per binge
- Frequency: Median 1.8 times monthly
- Heavy users: Top 25% binge 4.9 times per month
The data reveals concerning patterns among heavy users, who consume significantly more alcohol and drink more frequently than the median.
Economic Impact
- Total cost (2010): $15.322 billion
- Adjusted for inflation (2022): $20.685 billion
- Cost per drink (2022): $2.46
- Federal and state alcohol taxes: $0.23 per drink
The economic burden of alcohol use in Florida is substantial, with taxes covering only a small fraction of the societal costs.
Based on Florida's alcohol consumption data, while youth drinking shows encouraging decreases (47.3% to 28.2% from 2012-2023), adult excessive drinking remains a significant concern with 16.7% of adults engaging in risky behaviors. The annual toll is substantial: 10,655 deaths, over $20 billion in economic costs, and 255,673 years of potential life lost. The stark contrast between alcohol tax revenue ($0.23 per drink) and societal costs ($2.46 per drink) indicates a need for policy reform and enhanced prevention strategies.
Sources:
- Drug Abuse Statistics
- Drug Abuse and Addiction Statistics in Florida - Olympic Behavioral Health
- Substance Use Dashboard: Overview | CHARTS
- Drug Identified in Deceased Persons by Florida Medical Examiners (2022 Annual Report)
- 2023 Florida Youth Substance Abuse Survey Statewide Tables
- Florida Prescription Drug Abuse Statistics
- Florida Substance Abuse Statistics | Gulf Coast Recovery Center
- Substance Use, Perceptions of Great Risk, and Past Year Mental Health Measures: Among People Aged 12 or Older in Florida; by Age Group, Average Estimated Numbers (in Thousands), 2019 and 2020
- Substance Abuse and Rehab Statistics for Florida - NP Addict
- Florida Behavioral Risk Factor (BRFSS) Data - Florida Health CHARTS - Florida Department of Health
- 2019 Statistics: Alcohol Use in Florida - Ambrosia Treatment